CPI matchup Sint. Maarten vs. St.Estatius, Saba, Bonaire and the Netherlnds

Author & Project Owner
Don C. SeverinIntroduction
Micro ANTS, an approach to Data Science, uses case development and overall decision-making. The A.N.T.S. stands for Analysis, Navigation, Trial and Error, and Strategy, an approach designed for rapid-fire analysis, leveraging the latest data science methods to identify new and unperceived insights in our data. It’s particularly tailored for environments where swift discovery of critical insights is crucial. The Micro A.N.T.S. methodology encourages users to remember that data science is fun- damentally exploration and research. This methodology should reinvigorate hypothesis creation and development and validate our progression to more robust applications of your data. Micro A.NT.S represents an intelligent acceleration in approaching and interpreting large volumes of data, making it valuable for data scientists and the projects they want to undertake.
Purpose of the Study
The analysis employs the Micro A.N.T.S. methodology to conduct a Consumer Price Index (C.P.I) comparison between St. Maarten, Saba, St. Eustatius, Bonaire, and The Netherlands. St. Maarten was our target investigation, and the other Caribbean countries were chosen based on various similar- ities in location, size, population, etc. The Netherlands will be used for abstraction and to generate theories due to its influence and size. The significance of this analysis lies in its ability to provide critical insights into the economic status and costs of living trends within and across these regions, which are essential for policymakers, investors, but most importantly, the citizens. The focus will be on how the C.P.I. varies between these regions, what factors could contribute to these variations, and what further investigations we require to mitigate a negative trend. Data Science and Analysis are naturally geared toward answering questions; Micro A.N.T.S. aims to do more of the opposite and provoke thought, raising more questions for in-depth analysis.
Background
Consumer Price Index (CPI) is a vital indicator that measures the average change over time in the prices for a basket of goods and services. By focusing on the CPI, we can gain a deeper understanding of your purchasing power and cost of living. Such insights are significant when making informed decisions, whether in governmental policymaking, saving, and spending habits, or even how we as citizens vote in the next elections.
Research Questions
- What are the similarities and differences in C.P.I. trends among these regions?
- How can businesses and the government use these insights for strategic planning and decision- making?
Data Sources
The data under analysis in this document is taken from multiple sources. The first is The Department of Statistics (STAT) website, where we obtained the CPI figures for Sint Maarten. The remaining data comes from the Netherlands Centraal Bureau voor de Statistiek (CBS) data bank.
Data Characteristics
The data imported from CBS had a structure suitable for immediate analysis. The data was exported in four files holding 13 rows and 3 columns each. The columns were the Years from 2010 – 2022, CPI Values, and Percent of change. The file size was small at 1 kilobyte (kb). In comparison, our data sets from STAT were not consumable and were created more for presentation. File size ranges from 200 to 533 kilobytes per file. The data is extended, with the years of CPI moving from left to right. Interestingly enough, this data set held extra and valuable data on the CPI change and the consumer goods that make up the CPI “basket of goods.” The basket can include anything from groceries, automobile items, or rent, and we can utilize this information in future iterations of investigations. The data, however, still required a proper transformation to prepare for comparative analysis.
Data preperation
To make analysis more manageable, the data sets needed to be transformed into a usable form, which meant performing the following steps:
- Missing Value Check
- Feature Reduction
- Feature Renaming
- Shape Validation
- Concatenation
To clarify the above tasks, we first ensure that the data has no missing values that may cause plotting or errors in calculations performed. We refer to the term features, which describes a column within the data set with accompanying rows, then create more streamlined names and drop the unnecessary features in our dataset. The two final steps are in making sure the data has the same shape through our data sets and finally pulling them together making one singular working data set
Analytical Techniques
- Comparative Analysis
- Correlation Analysis
They will help us showcase a side-by-side view of any discrepancies, differences, and similarities between Sint Maarten’s CPI and the rest of the region and interpret their implications.
Variability
We will begin by generating statistical views on the data to help us formulate some inferences. Figure 1 below shows a few statistical indicators such as the count, mean, standard deviation, minimum and maximum, and percentiles. In this Micro ANT, we will direct our focus on the Standard Deviation
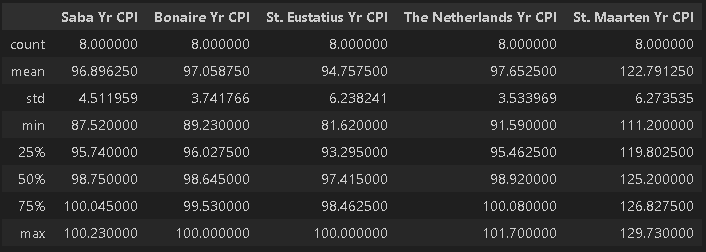
Standard deviation, in the context of this investigation, is intriguing due to its practical application in providing insights into variability or lack of consistency in a way that’s easy to understand. It helps us determine if the numbers in a given feature are closely grouped or diverge from its central value. This understanding aids in assessing the quality of control in the numbers and identifying potential risks associated with high variability. In our data set, we can identify a few patterns in the standard deviation of our features. Sint. Maarten and St. Eustatius have the highest deviations, 6.273535 and 6.238241. These are not only high dispersion levels but also similar, with only a difference of 0,03594. Our second observation is that The Netherlands and Bonaire have the lowest deviations, 3.533969 and 3.741766, and follow the trend of being similar, with a difference of 0.207797. We can already formulate more questions for further investigations by looking at the standard deviation results.
- Do the Netherlands and Bonaire have a better data collection method than Sint. Maarten and St. Eustatius?
- Is St. Maarten’s data accurate?
- If not a data issue, are the similarities in standard deviations due to a similarity in the tracked basket of goods?
- Does import and export frequency and quantity play a role in the deviations?
- Does location and shipping routes affect our CPI yearly, creating their high standard deviation?
Though the questions may seem far-fetched, they are a basis for investigating potential solutions to a glaring problem.
Centrality & Outliers
Let’s proceed with our investigation by looking into the data and its quality based on some of these initial thoughts. In Figure 2, we have generated a box plot showing the regions side by side in this investigation. We use the box plot to visualize the centrality, variability, and outliers within our data. Let’s use this tool to help us validate some of our previous theories
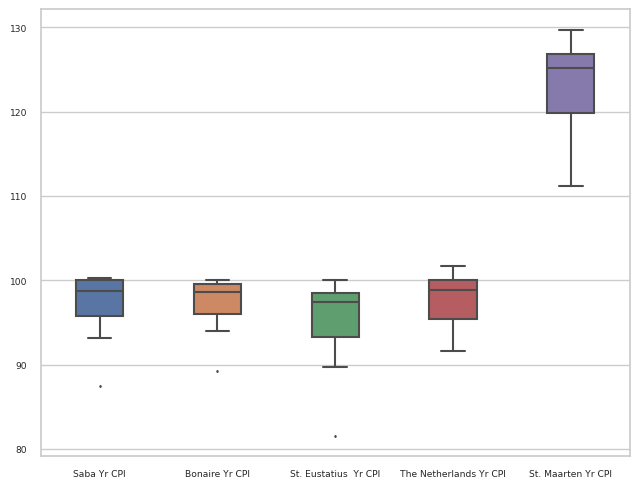
Looking at the box plot, we can clearly see that some of the selected regions all share a centrality. However, St. Maarten has risen to have a higher central distance than other regions. The box plot also reveals that Saba, Bonaire, and St. Eustatius produce what we call outliers, which are observations that are an abnormal distance from a defined normal range. The visualization affirms our previous inquiries as valid; however, what can we do to investigate further?
We can investigate the accuracy of St. Maarten’s CPI data as it presents as abnormal.
We can confirm regional consistency by collecting the following data sets.
- CPI ’basket of goods and services’ data
- Historical Import and export frequency
- Historical Import and Export locations
- Historical pricing data.
The box plot already reveals a troubling statement. Let us look at our CPI performance using an easier visualization in Figure 3, proving or disproving that our CPI is higher than those of these other countries
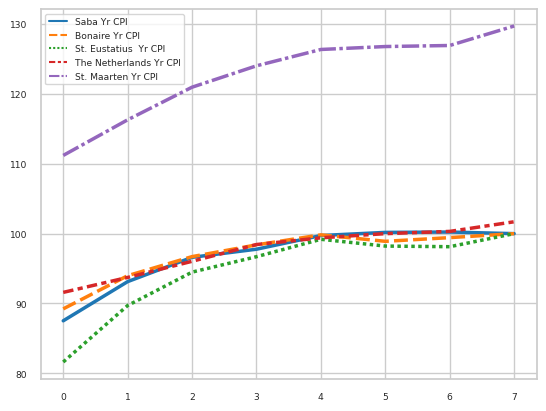
There, a much more familiar view depicts our significantly higher CPI rate and, ultimately, a constant increase in inflation. St. Maarten’s abnormally high CPI presentation necessitates our inves- tigation. A statistical overview, a box plot, and some simple line graphs helped us validate ideas on a perceived issue and will ultimately allow us to find a solution. Most of our analysis at this point depends on some relationship between the countries specified in the paper. We should determine the nature of their relationship and decide if we can utilize that to develop plans or further investigations for St. Maarten. Let us proceed to verify a correlation between these countries’ data sets.
Proven Relationship
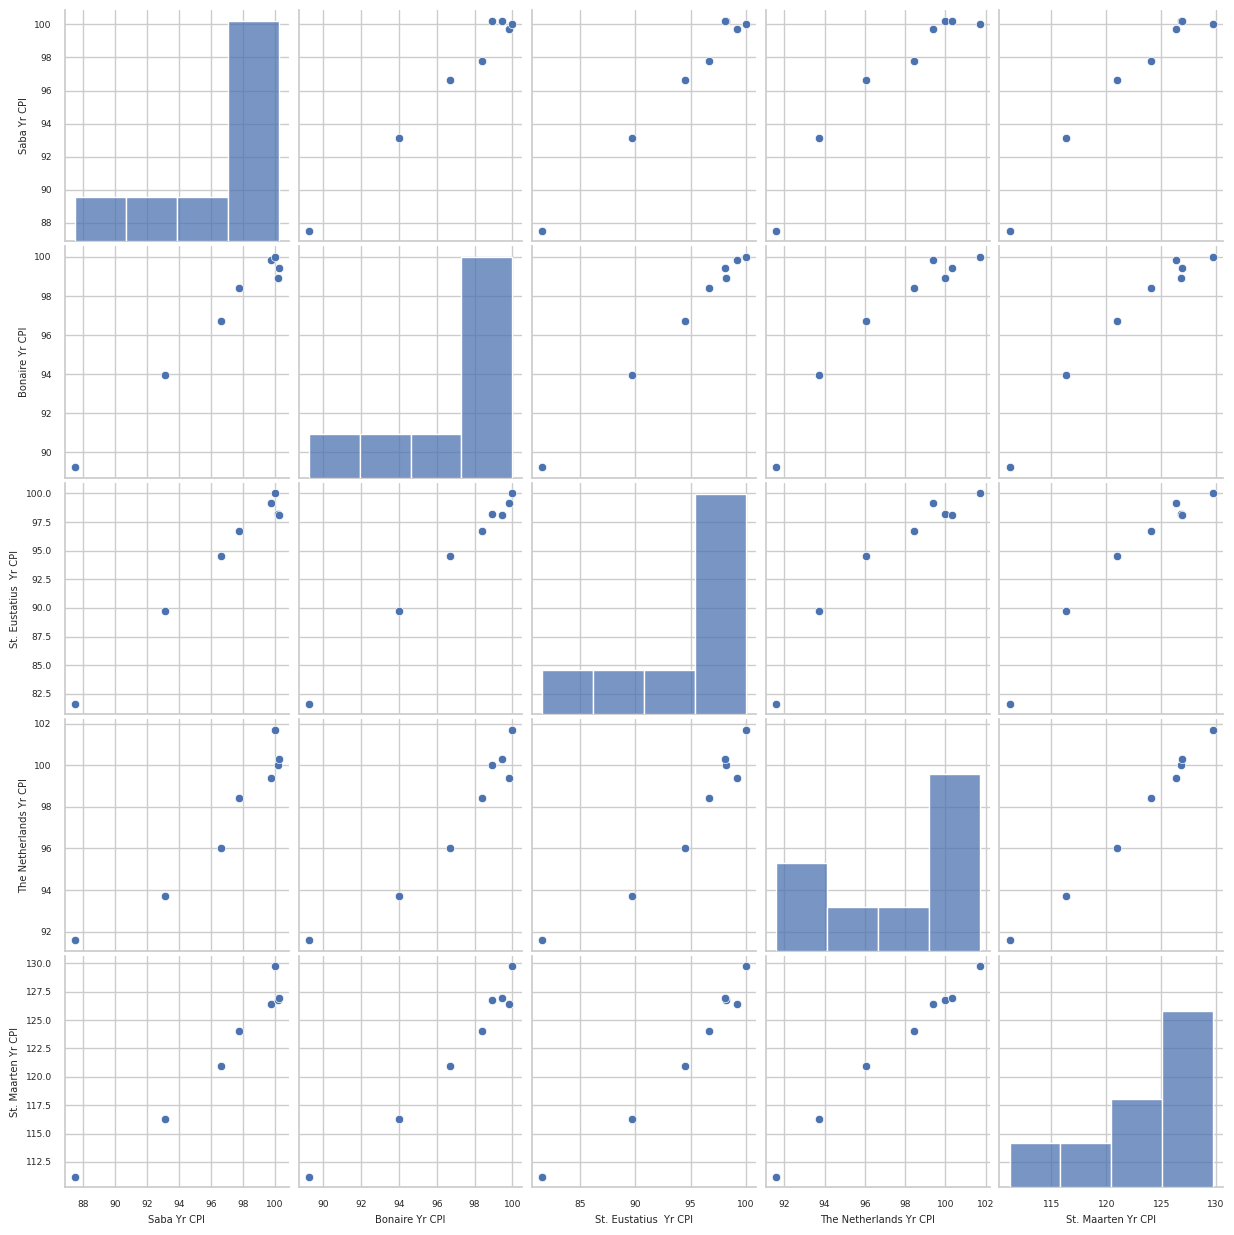
Correlations test how strongly two variables relate to one another. The relationships can be positive or negative. Though correlation does not directly mean cause, if we have a positive relationship with any of the other countries, we will use this as a green light for our investigation. First, in conducting a correlation check, we must choose between a few methods for calculating correlations. There are a few default choices, such as the Pearson Correlation Coefficient, Spearman Rank Correlation, and Kendall’s Tau. They all work a bit differently, but for this Micro ANTS, we will utilize the Pearson Correlation Coefficient as our data set complies with its requirements of linearly related variables. In Figure 4, we have tested the linear relationship using a matrix of scatter plots.
Now, we can determine if our data sets amongst the various countries correlate. Figure 5 shows the results using a Heat Map. Simply put, the blue defines a negative correlation, and the red defines a positive correlation.
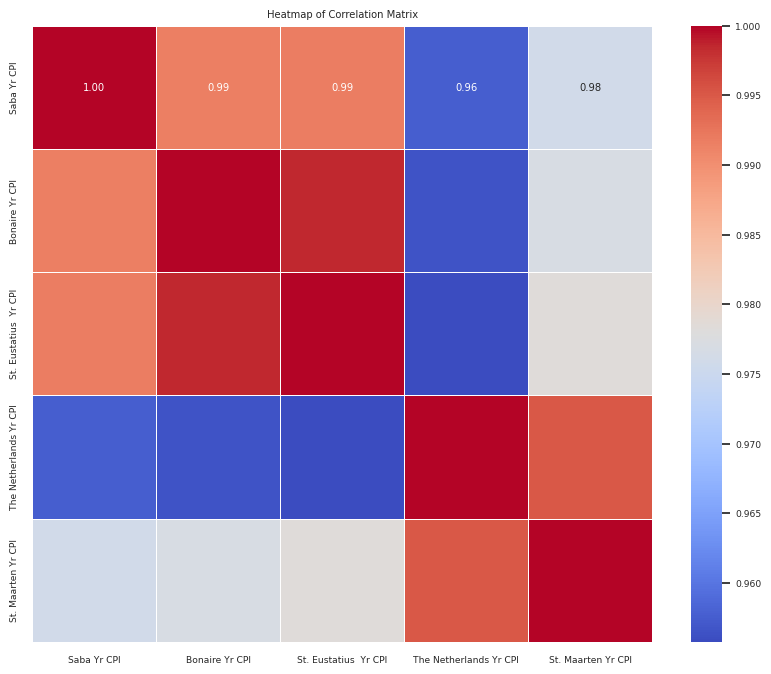
To help us move forward, let’s establish that a positive correlation means that if element a increases, so will element b. With a negative correlation, if element a increases, element b will decrease. Now that we have this in mind, let us look at our results. There is an immediate and glaring separation within the heat map. Saba, Bonaire, and St. Eu- statius are highly correlated but negatively correlated with The Netherlands and neutral with St. Maarten. On the other hand, the Netherlands and St. Maarten are highly correlated with each other and negatively correlated with Saba, Bonaire, and St. Eustatius. The Heat Map suggests that if any of the underlying factors, such as supply chain disruptions, monetary policies, and demand that affect CPI prices, were to increase in the Netherlands, The data suggests St. Maarten would indeed feel the effects. For example, if, in a given year, the Netherlands experiences significant inflation due to rising energy prices or increased consumer demand, the data suggests that St. Maarten will likely experience similar economic pressures. However, more importantly, are the effects equal to the country’s size and complexity? Can St. Maarten recover as fast from these increases as the Netherlands? Should we consider reducing our correlation, which would, in turn, afford us a reduction in our CPI rates?
Final Thoughts
The graph may indicate which countries are correlated, but it can also hint at areas that require more attention. Being correlated to a country like the Netherlands may not be terrible, but the level of correlation suggests practices that may be out of the scope of the country. When we look at Saba, Bonaire, and St. Eustatius, which are territories and public bodies of the Netherlands, they are far more similar to St. Maarten in location, geography, people, lifestyle, etc. Yet they've been able to maintain or even stay below the Netherlands in CPI trends. With this insight, we should also identify methods our neighboring countries employ to remain efficient and at a lower centrality point where CPI is concerned. While our analysis has limitations, I want to emphasize that these are not insurmountable. We fully acknowledge the constraints, be it by the availability of data, the methodologies applied, and the temporal scope of our research. Despite these, our primary objective has been to ignite a conversation and deepen the understanding of data science's role and potential in St. Maarten. We should continue this investigation, as there is excellent potential for improvement.