How Does Gross Domestic Product Relate to Happiness in St. Maarten: A Comprehensive Look?

Author & Project Owner
Don C. SeverinIntroduction
In the modern era, data science has emerged as a pivotal force in shaping public policy and enhancing quality of life across diverse regions. Its capacity to unravel complex patterns from vast datasets offers unprecedented opportunities for targeted, evidence-based decision-making. Sint Maarten, a vibrant island nation with unique socio-economic dynamics, presents an exciting setting for applying data science techniques, not due to the rich availability of data but just the opposite. The lack of or suppression of data by various organizations forces us to get creative and tap into our ability to utilize predictions and forecasting methods. This paper is structured to produce background information, describe our datasets, outline the methodology used, and discuss the predictions and models developed. This study contributes to a growing body of knowledge in our Micro ANTS context and data science’s transformative power in societal development.
Purpose of the Study
We all know that old adage ”Money can’t buy happiness, but it can make you awfully comfortable while you’re being miserable.”
In this Micro ANTS: Life Satisfaction, we intend to investigate the contributing factors to the well-being or satisfaction of citizens in St. Maarten. We will attempt to predict the life satisfaction score based on a predefined theory that a higher Gross Domestic Product Per Capita (GDP) equals a more satisfied society. This project will showcase the practicality and possible applications of data science and underscore its potential to influence societal well-being significantly.Research Questions
- Does the Gross Domestic Product Per Capita (GDP) equate to a happier society?
Data Sources
We ingest our data from multiple sources, the first being the Organization for Economic Co-operation and Development (OECD), an international organization geared towards shaping policy and improving lives all over the world. Here, we ingest our life satisfaction score for the year 2020 in select European countries. Our second source, The World Bank, is where we obtain the GDP per capita for the various countries in this study. They also have a humanitarian mission to end poverty worldwide. They provide an array of financial products and technical assistance that help countries share and apply innovative knowledge and solutions to the challenges they face.
Data Characteristics
The data sources are well-managed, which makes obtaining and processing them fairly simple. Both data sets are no larger than 100 kb, so we are dealing with a marginally small data set. This is already important information for model selection later in the analysis. The structure of both data sets is tabular in nature, so there will be no need for transformations in that regard. Both the World Bank and OECD adopted a data quality framework defining practices that should be followed to maintain accurate and reliable data. Therefore, we will proceed with the analysis with high confidence in the data obtained.
Data preperation
Once the data is ingested, it must be prepared to the specifications of our use case. For this, we will transform it into a single data set with the following steps:
- Missing Value Check
- Feature Reduction
- Feature Renaming
- Concatenation
- Filtering
These steps will become a staple in future papers as they represent the basis of any prepared dataset. To clarify the above tasks, we first ensure that the data has no missing values that may cause errors in our models’ calculations. We then rename and drop the unnecessary features in the dataset. The final step will combine them into one singular working data set to pass through our predictive model.
Analytical Techniques
With the preprocessed and validated data set, we will be able to perform predictive modeling to estimate the country’s life satisfaction score. Thus allowing us to understand the general satisfaction of the population that was previously unmeasured. To achieve our goal, we have two hurdles to overcome. First, finding a relationship between gross domestic product and Life Satisfaction. Secondly, selecting the right model to accurately predict the Life Satisfaction score with a relatively small data set.
Proven Relationship
Let’s start by uncovering a relationship between Gross Domestic Product and Life Satisfaction. In Figure 1, we generate a scatter plot, which is a simple yet powerful way to visualize two variables in search of relations.
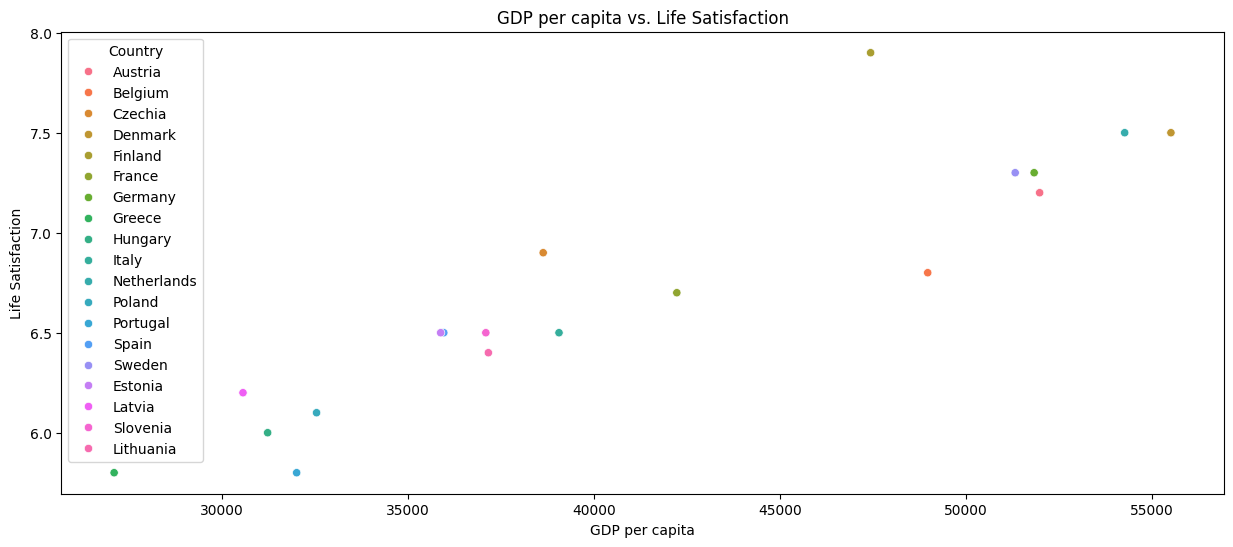
With this visualization, we can support the notion that if the Gross Domestic Product rises, so does the satisfaction of a population, making it a valuable element in further progressing life satisfaction.
Model Selection
When selecting a model, we can start by asking questions that will help us narrow our selection from the many available models and find one that fits our use case. To aid us, we have developed the following questions:
- What is the size of our data set?
- Is there linearity?
- Are there outliers in the data set?
- Does the data have a lot of features or missing data?
- Textual or numerical outcome?
- Accuracy or speed?
Model selection may vary depending on professional experience; however, closely identifying your data set characteristics, size, feature count, and dimensions is an important starting point in identifying your ideal model(s). In this case, our data set is fairly small due to filtering based on a specific year due to this speed is not a priority. The data has no outliers, missing data, or many features, and we are indeed predicting numerical outcomes. We’ve purposely left the question of linearity for last. Let’s update our Figure 1 plot with a regression line to better visualize in Figure 2 the linear relationship between these two variables so we can confirm a positive linear relationship.
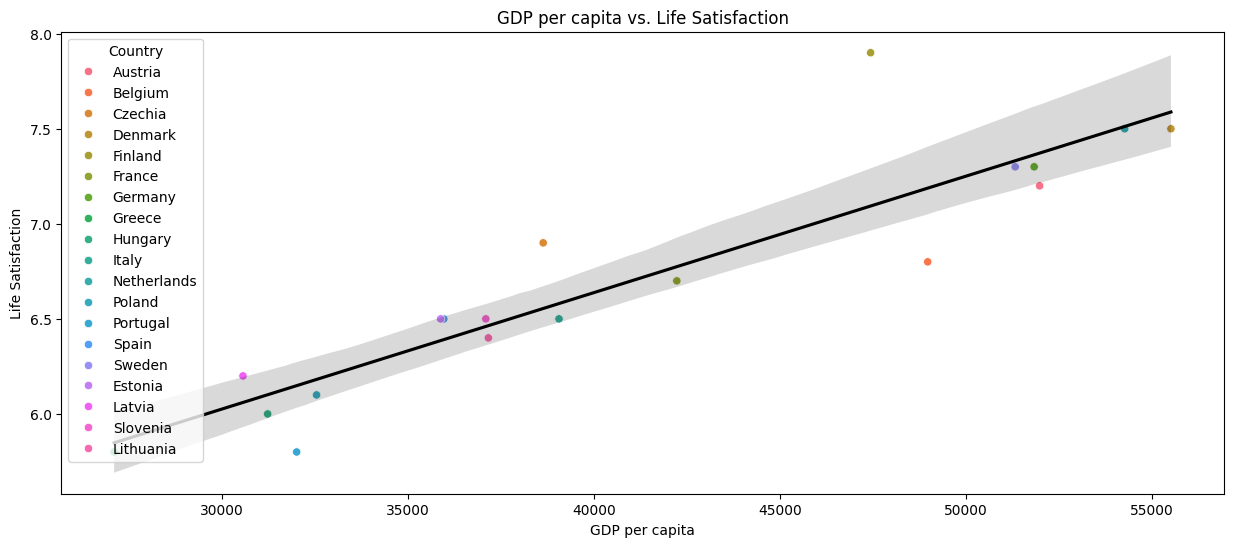
The linearity and expected numerical outcome allow us to identify the task as regression. There are a few models we can think of starting with, like linear regression models and the Ridge and Lasso regression models. These are all great choices as they can handle our smaller data sets, but we have selected Ridge Regressions due to its ability to reduce over-fitting & multicollinearity. Overfitting, in the simplest terms, is when a model aligns or learns a set of data points too closely and performs well on a test set but not new data. Multicollinearity is when several or two variables are highly correlated. This can present problems in the model’s performance. Our Ridge regression model is able to handle these issues, thus improving accuracy and the overall acceptance of our project.
Prediction
As we transition from the initial setup, theoretical framework, and data exploration to the practical application of our findings, this section of the paper is dedicated to the prediction aspect of our study. Our objective is to harness the power of predictive modeling to forecast life satisfaction in Sint Maarten based on various indicators. In this instance, we will focus on Gross Domestic Product per capita (GDP). This predictive endeavor not only demonstrates the utility of data science research but also aims to provide actionable insights that can guide policy-making and strategic planning. Our prediction process begins with dividing the dataset into training and testing sets. This part of the process sets the model up for success. Figure 3 shows how we split the data
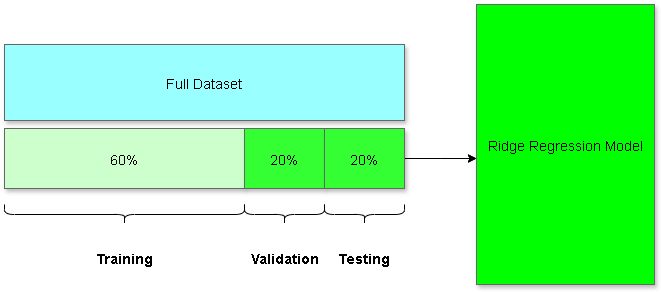
This allows us to validate our models’ ability to generalize from new data by saving a subset of unseen data to feed after the model has been trained. In addition, we implement cross-validation techniques to fine-tune our model and select the optimal parameters, thereby avoiding overfitting and ensuring that our predictions are both robust and reliable. In Figure 4, we can evaluate the model’s performance by outputting various metrics.
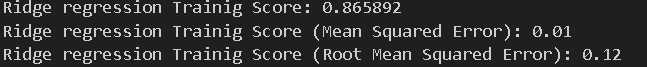
The model is performing at 86.5% accuracy when scored using (R2), which evaluates the fit and, therefore, a measure of how well-unseen samples are likely to be predicted by the model. This will be sufficient for the purposes of this paper. Let us add a visual medium to realize further the estimated distance from the truth our model has achieved. In Figure 5; we have used scatter plots to plot our prediction values and also a reference line that denotes the ytest or known values from minimum to maximum.
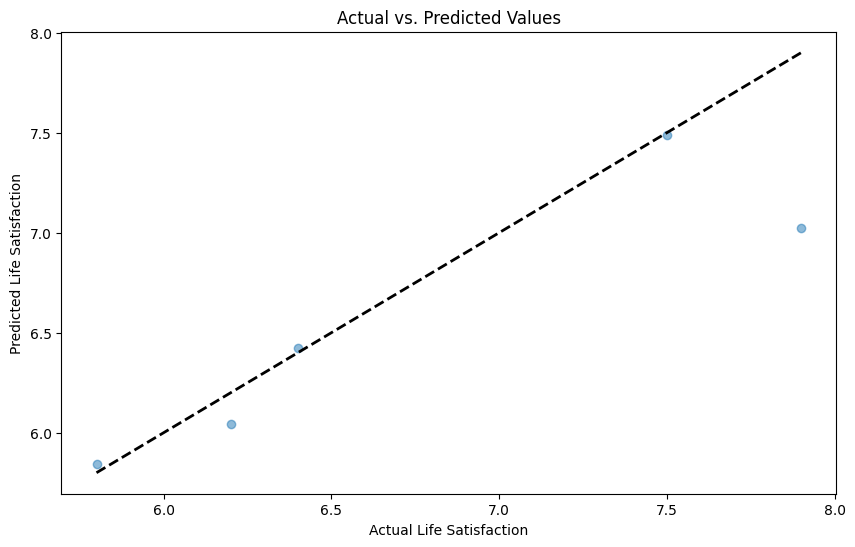
Looking at the plot, we can see our predictions are in close proximity to our actual values. So we can now proceed in predicting new values, confident that the prediction will be within reason. St. Maarten’s Gross Domestic Product per capita (GDP) for the year 2020 was 29,223.07 USD or 26.912,84 EUR. When we input this number into our trained model, we get a life satisfaction score of 5.9. If we want to see where this places us in terms of the other countries we’ve selected earlier, we can view this in Figure 6
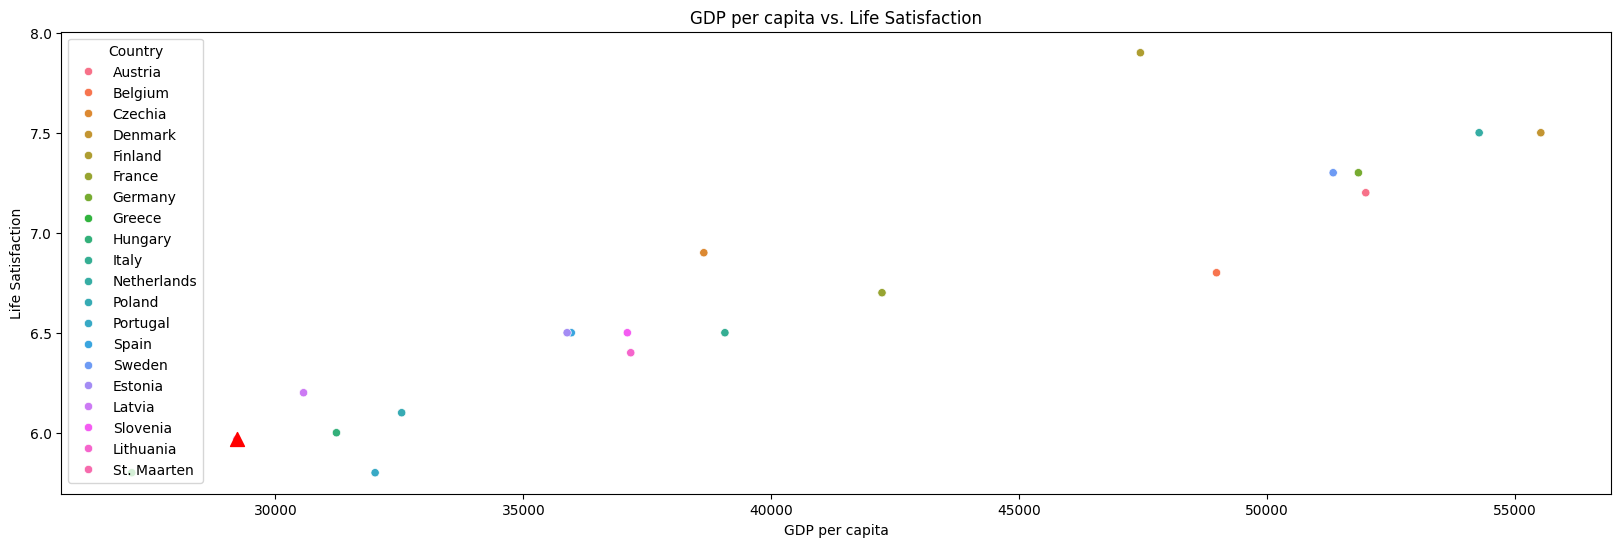
You can observe our position by the red triangle; this translates into a relatively unsatisfied pop- ulation where GDP is concerned. For policymakers, the life satisfaction score serves as a directive to reassess and realign strategies that directly affect the happiness and contentment of the populace. It challenges them to innovate and implement policies that not only address the deficits identified in this study, but to enhance areas that contribute positively to the community’s overall satisfaction. With the understanding that GDP is only one singular factor, we can continue our research into the areas that can affect the life satisfaction score. Furthermore, for the people of Sint Maarten, this score provides a measure of their collective well-being and a framework within which they can advocate for change. Armed with this data, communities are better equipped to voice their needs and collaborate with local authorities to shape an environment that fosters greater life satisfaction.
Final Thoughts
In conclusion, the value of data science in this context is immeasurable. It not only provides a snapshot of the present state of life satisfaction based on GDP but also equips us with the knowledge and tools to build a better future. As we continue to refine our models and expand our data, our predictions and insights will only become more accurate and, consequently, our interventions more effective. This ongoing cycle of analysis, implementation, and evaluation is essential as we strive towards enhanced societal well-being.